For decades, technical analysis has been one of the most important tools for traders. Support and resistance levels, trendlines, chart patterns, Fibonacci retracements — all of these concepts are widely used across stocks, crypto, forex, and futures markets.
However, traditional technical analysis comes with major limitations:
- Drawing trendlines manually is time-consuming
- Support and resistance levels are often subjective
- Human bias leads to inconsistent analysis
- Backtesting strategies accurately requires advanced technical skills
- Monitoring multiple assets across timeframes is nearly impossible without automation
As markets become faster and more competitive, traders who rely solely on manual analysis are increasingly at a disadvantage.
This is where AI-powered technical analysis enters the picture — and TrendSpider has positioned itself as one of the most advanced platforms leading this transformation.
What Is TrendSpider?
TrendSpider is an advanced charting and technical analysis platform designed to help traders make more objective, data-driven decisions using automation and artificial intelligence.
Unlike traditional charting tools, TrendSpider automatically detects:
- Trendlines
- Support and resistance levels
- Chart patterns
- Candlestick patterns
- Multi-timeframe confluence
Instead of spending hours drawing and adjusting charts, traders can focus on strategy, risk management, and execution.
TrendSpider is widely used by:
- Active traders
- Swing traders
- Crypto traders
- Options traders
- Algorithmic traders
- Institutional-style retail traders
You can explore the platform here:
Why Manual Charting Is Holding Traders Back
1. Human Bias Ruins Consistency
Two traders can look at the same chart and draw completely different trendlines. This subjectivity leads to:
- Conflicting trade setups
- Emotional decision-making
- Poor risk management
TrendSpider removes this bias by applying consistent mathematical rules across all charts.
2. Time Is a Trader’s Most Valuable Asset
Manually analyzing:
- 50 stocks
- Across 5 timeframes
- Every trading day
…is simply not scalable.
TrendSpider automates this process in seconds, allowing traders to analyze hundreds of assets simultaneously.
3. Backtesting Is Often Inaccurate or Impossible
Most retail traders:
- Don’t backtest properly
- Use limited historical data
- Rely on gut feelings instead of statistics
TrendSpider integrates robust strategy backtesting, allowing traders to validate ideas before risking real capital.
Key Features That Make TrendSpider Stand Out
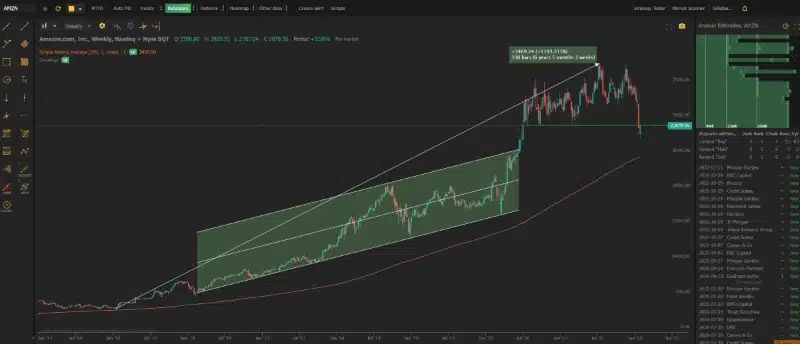
Automated Trendlines & Support/Resistance
TrendSpider uses algorithms to automatically identify:
- Valid trendlines
- Key horizontal levels
- Volume-weighted levels
These levels are recalculated dynamically based on price action — eliminating guesswork.
Result: Cleaner charts, faster decisions, better consistency.
Multi-Timeframe Analysis (MTFA)
One of TrendSpider’s most powerful features is true multi-timeframe analysis.
You can:
- View daily, weekly, and monthly levels on an intraday chart
- Identify high-probability confluence zones
- Avoid trading into higher-timeframe resistance
This feature alone gives traders a massive edge over traditional charting platforms.
AI-Powered Pattern Recognition
TrendSpider automatically detects:
- Chart patterns (triangles, wedges, channels)
- Candlestick patterns
- Breakouts and breakdowns
Instead of scanning charts manually, traders can instantly spot high-quality setups across the entire market.
Strategy Backtesting Without Coding
TrendSpider’s Strategy Tester allows traders to:
- Build rule-based strategies
- Test them across years of historical data
- Analyze win rate, drawdown, and expectancy
All without writing a single line of code.
This is a game-changer for traders who want data-driven confidence.
Alerts That Actually Matter
TrendSpider’s alerts are not basic price alerts.
You can set alerts based on:
- Trendline breaks
- Indicator conditions
- Multi-timeframe levels
- Pattern completions
This allows traders to stay disciplined and avoid staring at charts all day.
Raindrop Charts & Advanced Visualizations
TrendSpider offers unique chart types such as:
- Raindrop charts
- Volume-by-price analysis
- Session-based volume profiles
These tools help traders understand institutional behavior rather than just price movement.
Who Should Use TrendSpider?
TrendSpider is not just for professional traders — but it truly shines for traders who value efficiency and data.
Ideal Users Include:
- Traders tired of manual charting
- Swing traders managing large watchlists
- Crypto traders trading multiple pairs
- Options traders needing precise levels
- Algorithmic traders validating strategies
- Busy professionals trading part-time
If you care about objective analysis over opinions, TrendSpider is built for you.
TrendSpider vs Traditional Charting Platforms
| Feature | Traditional Platforms | TrendSpider |
|---|---|---|
| Manual Trendlines | Yes | Automated |
| AI Pattern Detection | No | Yes |
| Multi-Timeframe Levels | Limited | Advanced |
| Strategy Backtesting | Complex | No-code |
| Bias-Free Analysis | No | Yes |
| Scalability | Poor | Excellent |
This comparison makes it clear why many traders eventually migrate to TrendSpider.
Real-World Trading Benefits
Traders using TrendSpider often report:
- Faster decision-making
- Higher confidence in setups
- Improved discipline
- Reduced emotional trading
- Better risk-to-reward planning
The platform doesn’t promise profits — but it dramatically improves the quality of decisions, which is the only thing traders can control.

SEO Insight: Why TrendSpider Is Growing Rapidly
From an SEO and market adoption perspective, TrendSpider benefits from several macro trends:
- Rising interest in AI trading tools
- Growth of retail and crypto trading
- Demand for automation and efficiency
- Shift toward data-driven decision-making
As trading becomes more competitive, tools like TrendSpider are no longer optional — they are essential.
How to Get Started With TrendSpider
Getting started is simple:
- Visit TrendSpider
- Choose a plan based on your trading style
- Import your watchlist
- Enable automated analysis
- Start testing strategies and setting alerts
Most traders see value within the first few hours of using the platform.
Final Thoughts: Is TrendSpider Worth It?
If you are serious about trading and want to:
- Remove bias from your analysis
- Save time
- Trade more systematically
- Make decisions backed by data
Then TrendSpider is absolutely worth considering.
It doesn’t replace trading skills — it amplifies them.
In an era where speed, consistency, and automation define success, TrendSpider stands out as one of the most powerful technical analysis platforms available today.
Explore TrendSpider here: